Performance benchmarking
In recent years, the PD14 model became an established Computational Neuroscience benchmark for various soft- and hardware architectures. The article “Constructive community race: full-density spiking neural network model drives neuromorphic computing” (Senk et al., 2026) reflects on this development and presents the performance data points available at the time of publication. We suggest to cite this article as a permanent reference. This documentation instead represents a living reference for the performance results in figure and table format below and welcomes new data points. If you have managed to implement and run PD14 on a new computing platform not yet discussed in 1, we are happy to add your performance result if a corresponding peer-reviewed, published article can be cited describing the technology. Alternatively, if the technology is already published and you have obtained a new result based on further optimizations of software or hardware, we may not require a separate publication but just an explanatory paragraph to be published in this repository. In case you plan such a submission please reach out to the contacts of this repository before doing a pull request.
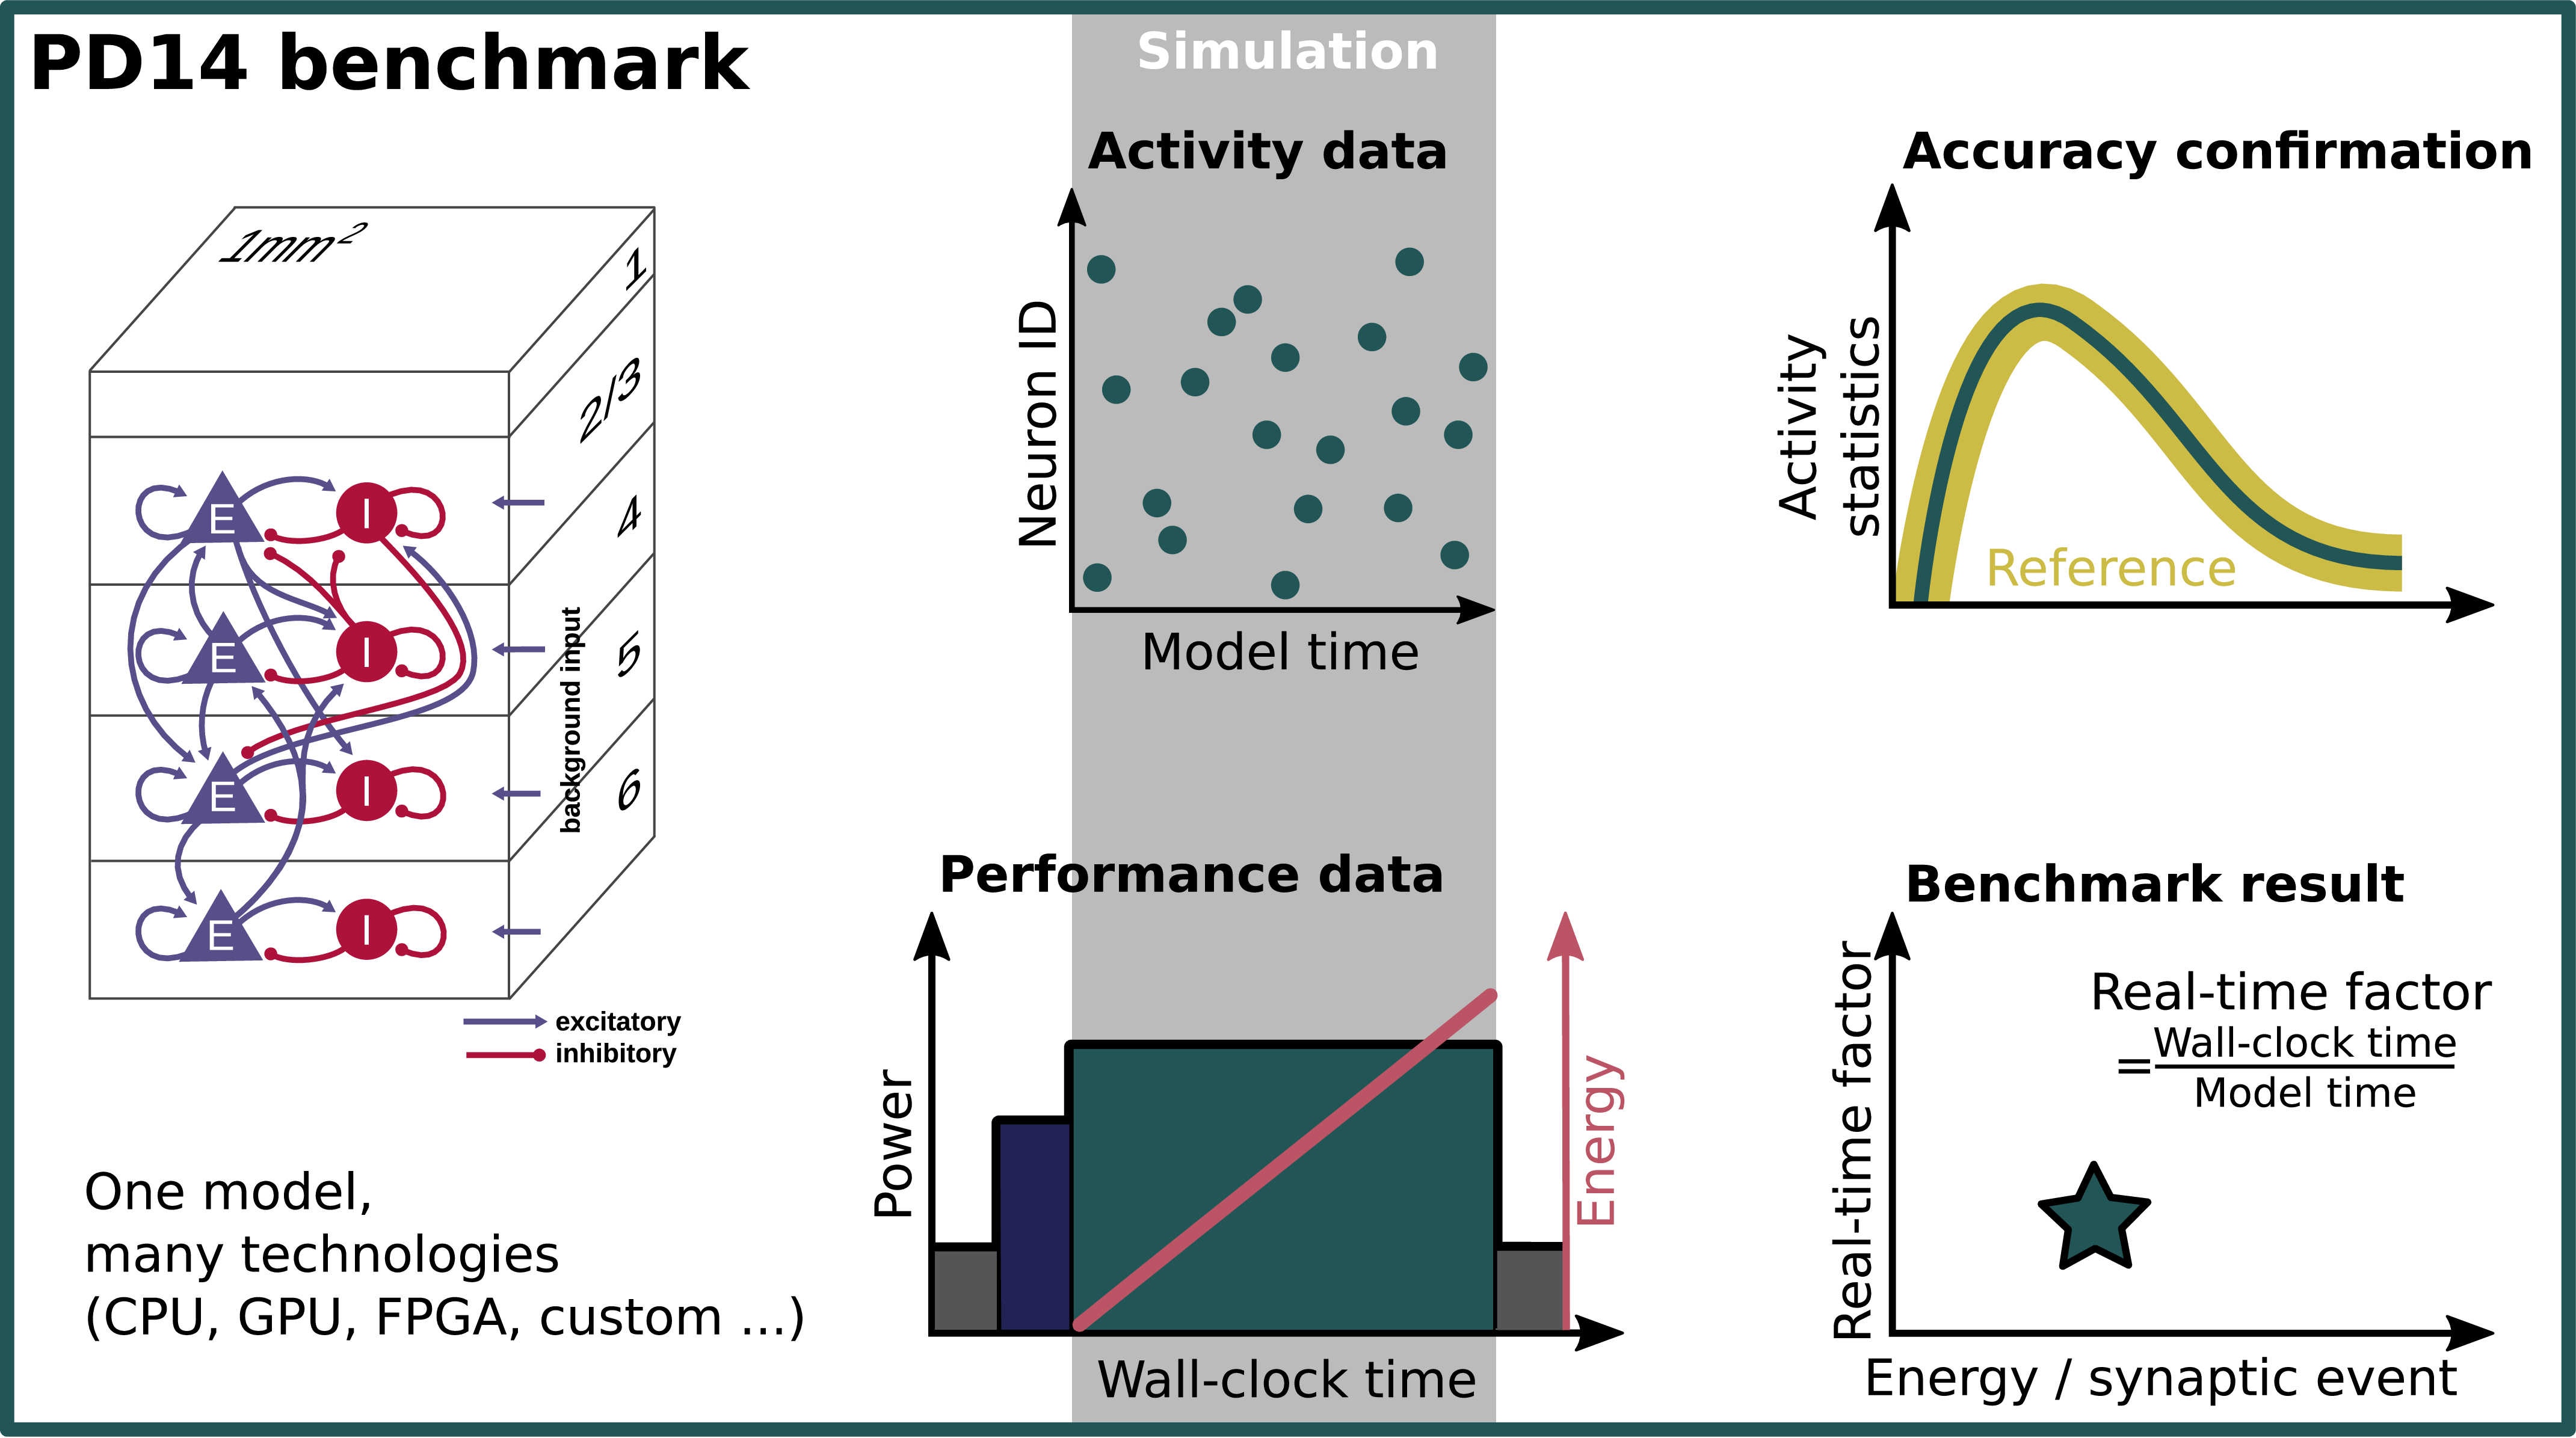
Spiking network model (PD14) of full circuitry below \(1\ \text{mm}^2\) surface area of cerebral cortex serves as benchmark for neuromorphic technologies. The statistics (dark cyan curve) of the simulated activity (dark cyan dots) is compared to reference data (thick yellow curve). Once sufficient accuracy is confirmed, the power measured during the simulation phase (light gray background) yields the consumed energy (dark cyan area corresponds to end point of light red curve, dark blue area indicates network construction phase, dark gray idle phase). The performance benchmark result (dark cyan star) contrasts the real-time factor (defined as the ratio of required wall-clock time and biological time covered by the model) against the required energy (expressed as energy per synaptic event). Figure from (Senk et al., 2026).
Performance data of different computing platforms
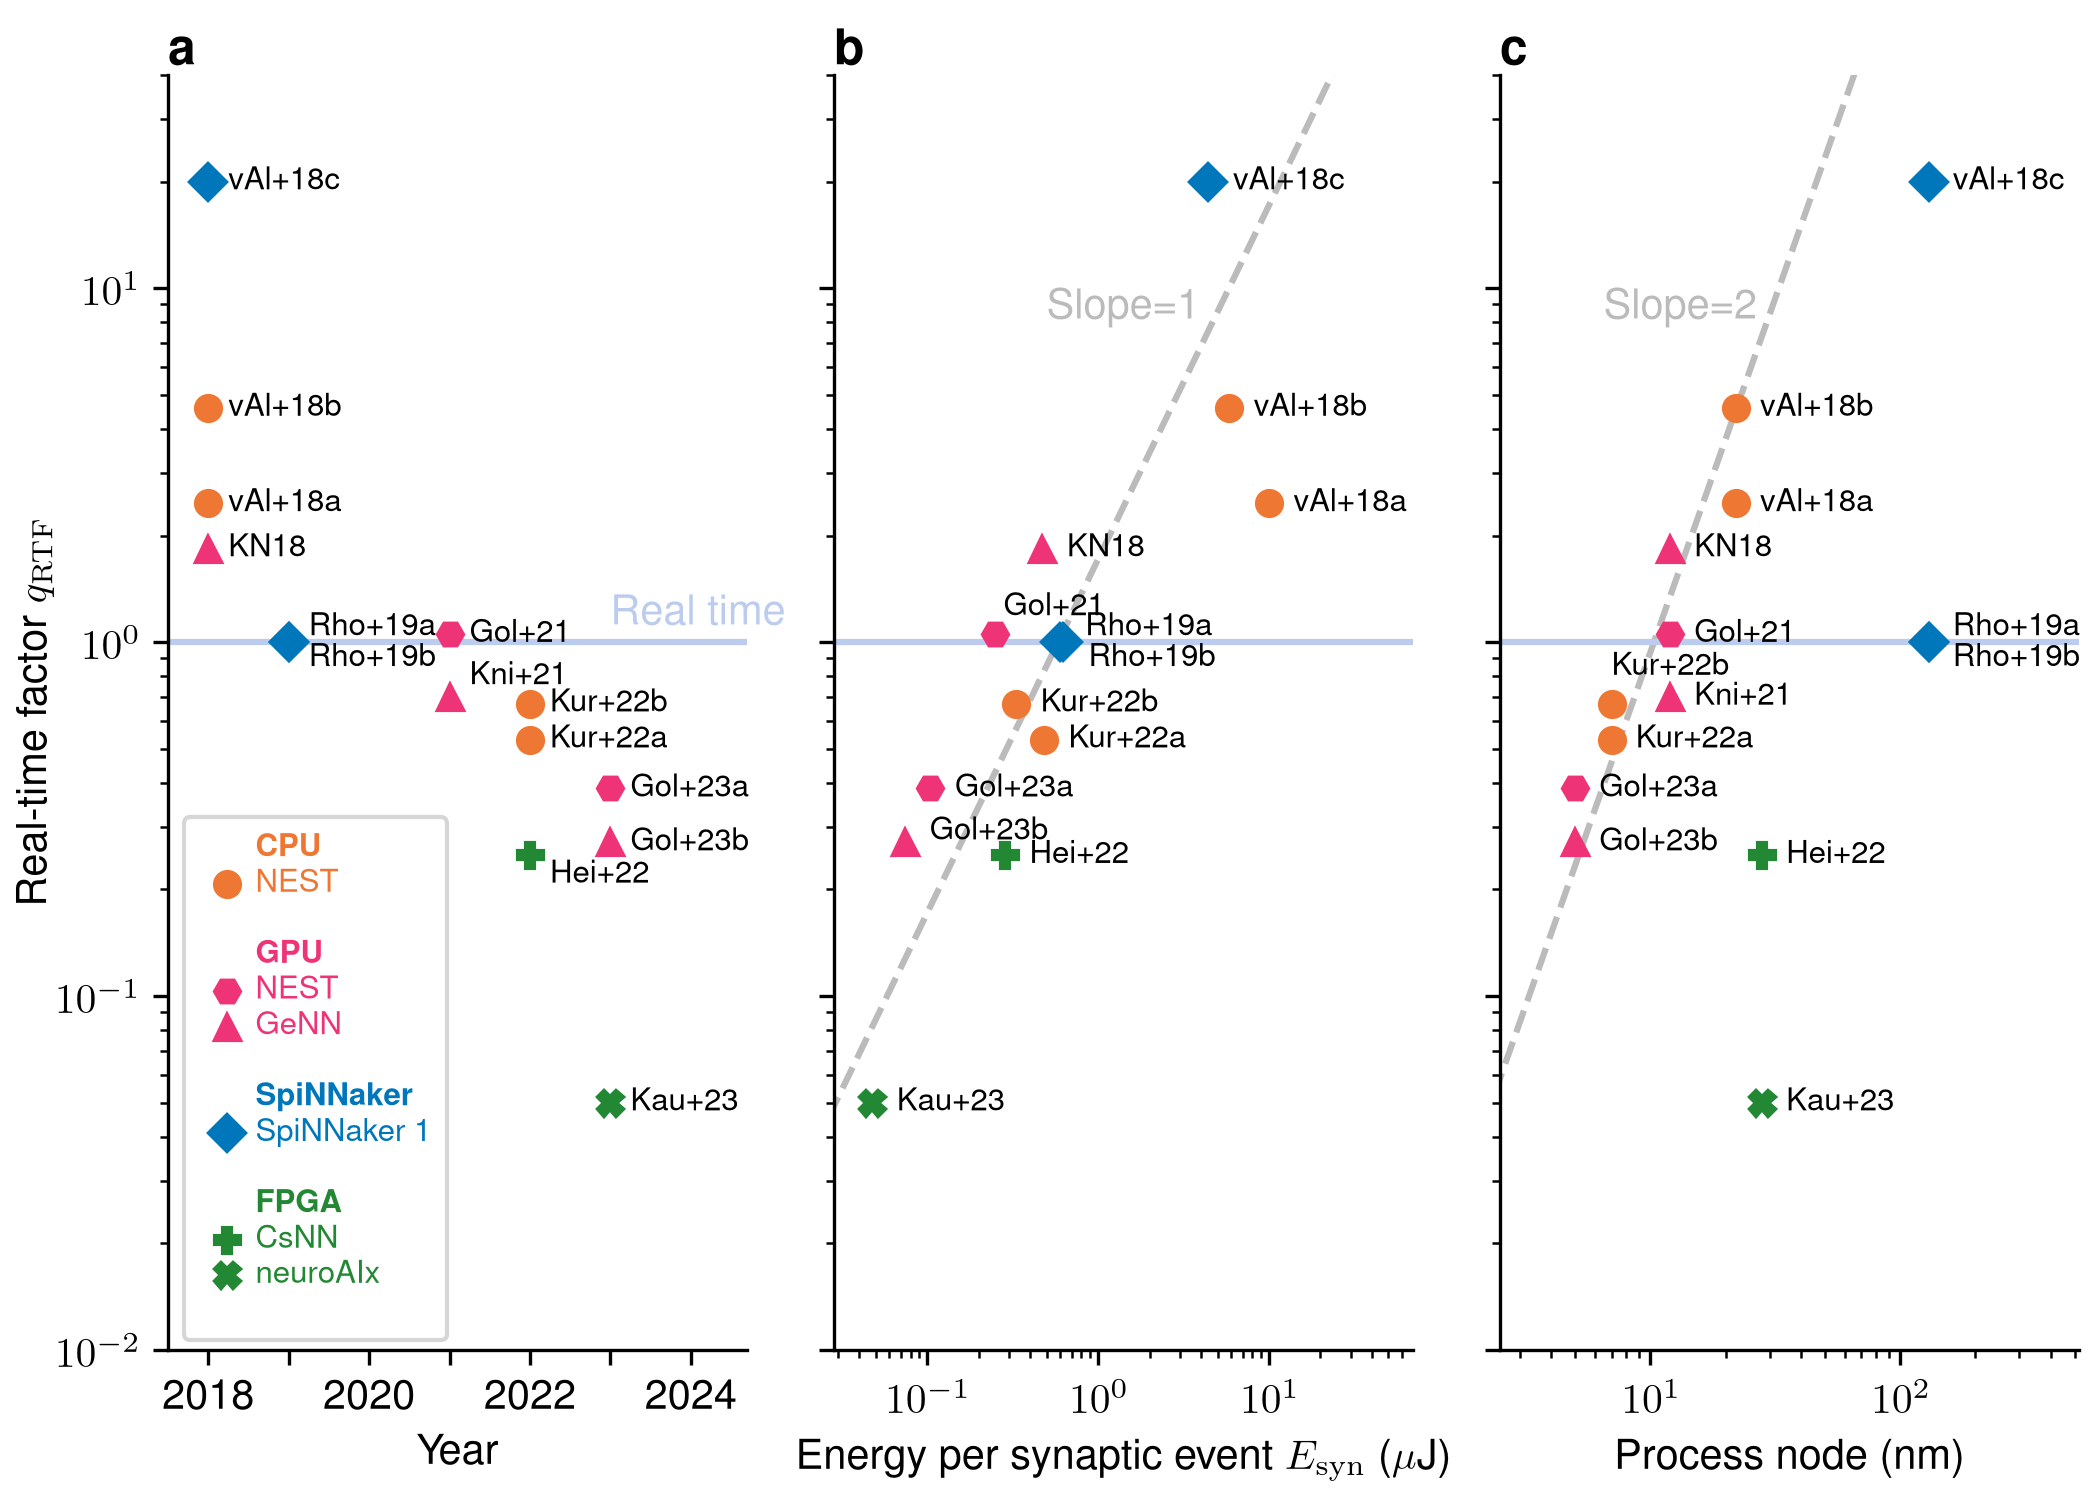
Progress of the community in reduction of time to solution and energy consumption for the PD14 model. Colors group hardware architectures and shapes indicate algorithmic approach (legend). Abbreviations in panels further disambiguate individual studies. (a) Ratio between time passed on wall-clock and stretch of time covered by the model (real-time factor) versus the year of publication in semi logarithmic representation. (b) Real-time factor as a function of energy per synaptic event in double logarithmic representation. Dashed line from fit through all data points with a slope of one. (c) Real-time factor versus process node in double logarithmic representation. Dashed line from fit through CPU and GPU data points with a slope of two. Citations of studies and values are given in the following table. Figure from (Senk et al., 2026).
Performance summary table
Study |
Real-time factor \(q_\text{RTF}\) |
Energy per synaptic event \(E_\text{syn}\) (\(\mu\text{J}\)) |
Simulator |
#Nodes |
System |
Process node (nm) |
External drive |
|
|---|---|---|---|---|---|---|---|---|
vAl+18a |
van Albada et al. (2018) |
2.465 |
9.941 |
NEST CPU |
12 |
2 Intel Xeon E52680v3 |
22 |
DC |
vAl+18b |
van Albada et al. (2018) |
4.584 |
5.816 |
NEST CPU |
3 |
2 Intel Xeon E52680v3 |
22 |
DC |
vAl+18c |
van Albada et al. (2018) |
20 |
4.4 |
SpiNNaker 1 |
6 |
48 x 18 x ARM-968 |
130 |
DC |
KN18 |
Knight and Nowotny (2018) |
1.838 |
0.47 |
GeNN |
1 |
Tesla V100 |
12 |
Poisson |
Rho+19a |
Rhodes et al. (2019) |
1 |
0.601 |
SpiNNaker 1 |
12 |
48 x 18 x ARM-968 |
130 |
DC |
Rho+19b |
Rhodes et al. (2019) |
1 |
0.628 |
SpiNNaker 1 |
12 |
48 x 18 x ARM-968 |
130 |
Poisson |
Gol+21 |
Golosio et al. (2021) |
1.055 |
0.25 |
NEST GPU |
1 |
RTX 2080 Ti |
12 |
Poisson |
Kni+21 |
Knight et al. (2021) |
0.7 |
nan |
GeNN |
1 |
Titan RTX |
12 |
Poisson |
Hei+22 |
Heittmann et al. (2022) |
0.25 |
0.284 |
CsNN |
345 |
IBM INC-3000 |
28 |
Poisson |
Kur+22a |
Kurth et al. (2022) |
0.53 |
0.48 |
NEST CPU |
2 |
2 AMD EPYC Rome 7702 |
7 |
DC |
Kur+22b |
Kurth et al. (2022) |
0.67 |
0.33 |
NEST CPU |
1 |
2 AMD EPYC Rome 7702 |
7 |
DC |
Gol+23a |
Golosio, Villamar, Tiddia et al. (2023) |
0.386 |
0.104 |
NEST GPU |
1 |
RTX 4090 |
5 |
DC |
Gol+23b |
Golosio, Villamar, Tiddia et al. (2023) |
0.272 |
0.074 |
GeNN |
1 |
RTX 4090 |
5 |
Poisson |
Kau+23 |
Kauth et al. (2023) |
0.05 |
0.048 |
neuroAIx |
35 |
NetFPGA SUME |
28 |
DC |
Benchmarking recipe
Cortico-cortical inputs |
State whether DC or Poisson is used (see model description) |
Initial conditions |
Optimized initial conditions: distribute membrane potentials normally with population-specific mean and variance (see model description) |
Warm-up time |
Discard the initial 500 ms of model time from the data to be analyzed |
Simulation duration |
Accuracy: \(T_\text{model}=15\ \text{min}\), performance: \(T_\text{model}\ge 10\ \text{s}\) |
Repeated simulations |
Statistics across ten realizations of the model (RNG seeds) |
Spike recording |
Accuracy: yes; performance: no |
Accuracy metrics |
Compute distributions of 1) single-neuron firing rate (FR), 2) coefficient of variation (CV) of the inter-spike intervals (ISI), and 3) short-term spike-count correlation coefficients (CC), and compare with reference data |
Performance metrics |
Measure real-time factor \(q_\text{RTF}\) and the energy per synaptic event \(E_\text{syn}\) (include all contributions necessary for running the simulations at the power outlet) |
Checklist with recommended model and simulation parameters for the PD14 model. Table adapted from (Senk et al., 2026).
Video
Watch this video for an introduction to the benchmark and the history of this community race:
